


Measuring the return on
technology investments has nearly always been challenging—hidden costs like
deployment time and user adoption are some of the factors that can impede
successful implementation and diminish ROI. It’s even tougher now, considering
how frequently technology changes and how quickly business goals can shift.
With a new analytics service called Productivity Score, Microsoft aims to help organizations increase ROI on their tech investments, minimize the adoption challenges, and increase employee productivity and engagement.1
Productivity Score is designed to help organizations in three broad areas:
Provide you with a clear view of how your organization works
How well
is your organization using Microsoft 365? You can find out on the Productivity
Score home page, which provides current and historical data about everything
from how employees communicate to which Office apps have the highest adoption
rates.
An
organization’s score is influenced by two factors, the employee experience
and the technology experience. The former provides a snapshot of
employee productivity and engagement—it illustrates the number of employees
using email vs. Microsoft Teams to communicate about projects over time; the
percentage of employees participating in online vs. in-person meetings; the percentage
of people collaborating on Office documents; the number of people who use apps
across multiple platforms, as well as other factors.
The technology experience helps organizations identify common tech pain points such as slow boot times, hanging apps and sluggish logins. For example, an organization may see the following message: “You have 671 devices using HDDs (hard disk drives). On average, these devices boot 77.68 seconds slower and sign in 26.93 seconds slower than your SSD (solid state drive) devices.”
Deliver insights that identify where you can enable improved experiences
From the
home page, click “view detail” at the bottom of a section to dig deeper into your
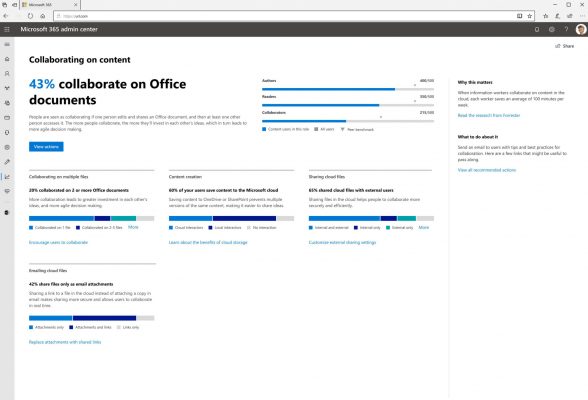
organization’s productivity. For example, when you click through to collaboration
insights, you can see how many users shared links to cloud files vs. how many
shared cloud files as email attachments. The page provides you with insights,
too—such as why sharing links is more secure and efficient than sending
attachments.
This page also includes academic insights to help you understand the correlation of what Microsoft is measuring to productivity. For example, the right side of the detail page for collaboration includes supporting information—“When information workers collaborate on content in the cloud, each worker saves an average of 100 minutes per week”—plus a link to relevant research by Forrester.
Recommend actions to update skills and systems so everyone can do their best work
Detail
pages also include recommended actions. For the earlier collaboration example,
the page might suggest sending an email to users with tips and best practices
for collaboration, plus links to other resources.
To keep up, organizations
must keep a close watch on productivity and engagement, and whether the technology
employees rely on is helping or hindering them.
People, after all, are key to success. By combining a tool like Microsoft Productivity Score with a comprehensive digital adoption solution—complete with training, support, continuous learning, and change management services—organizations can stay competitive, and also guarantee they are innovative.
1. According to the Microsoft Roadmap, Productivity Score is now available to organizations that have a subscription to Microsoft 365 or Office 365 commercial plans who are in the multi-tenant cloud.